One thing we rely on as Real Estate agents is good data and good biscuits.
You can a get a biscuit pretty much anywhere these days, but if you think that what McDonald’s serves as an over-salted over-sweetened biscuit is what it means to have a morning filler then you have spent too much time at the food courts on the Jersey Turnpike. The only quick-fix-to-go biscuit that is worth anything in Richmond is the one from the Ukrop’s Cafe — now part of Martin’s.
The second thing we rely on as Agents is good data. And by that I mean data that is correct. You will see the disclaimer on everything an Agent hands you “data deemed reliable but not guaranteed” and what follows is precisely why.
The data in the Multiple Listing System is entered by other Agents. We then assume that Agents would want correct data for other Agents, and the public, to work with.
Well sure enough, just like someone can over salt them biscuits before you swing around in the drive through, you can have some over-inflated figures. And one over-inflated figure that I will show you is one that I provided to you myself on another post on this site. How did it get to be over-inflated? I relied on data in the system. So now I have to go back and adjust my figures downward for one of the prior calculations on the average sale price in a subdivision. It pains me to do it, because this subdivision is dear to my heart, but here it goes.
Good ‘ole Tuckahoe Village is getting a downward adjustment. The previous data showed that the average sales price in 2011 for single family homes in Tuckahoe village was $187,000 ($187,044.12 to be exact). That is now downgraded to $183,410.71.
Why?

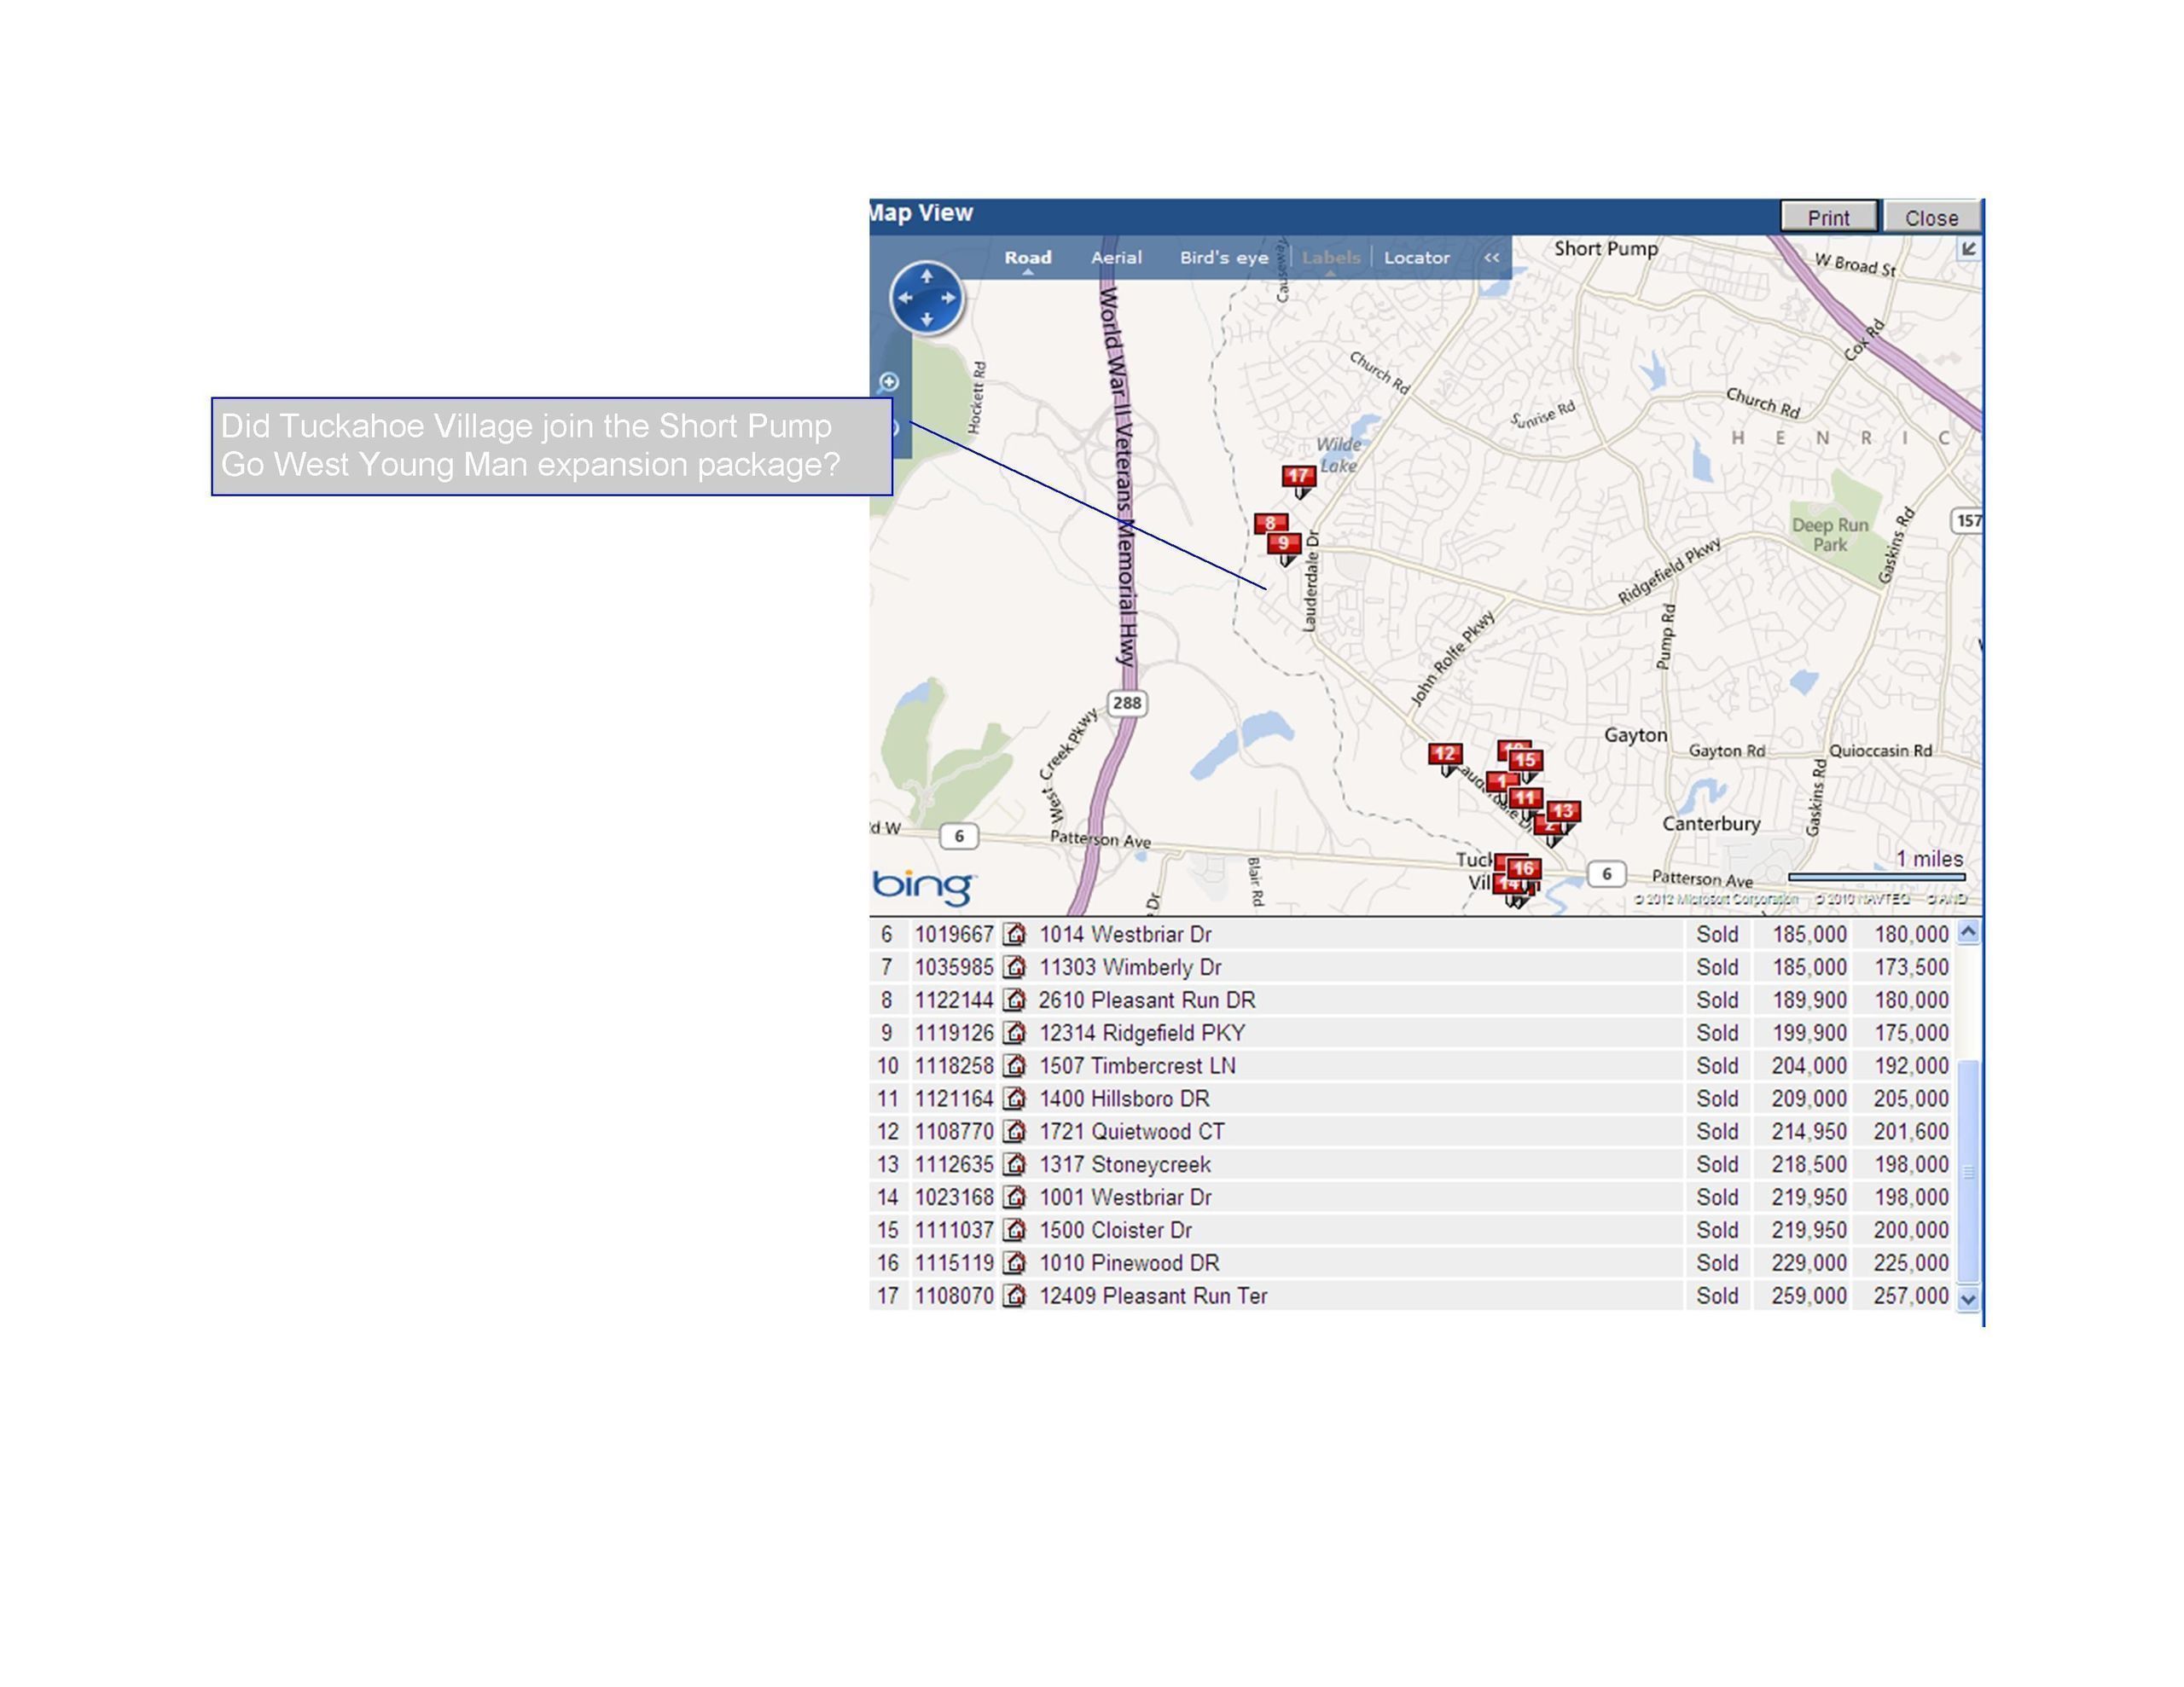
Homes Labeled Tuckahoe Village Instead of Tuckahoe Village West
Because three listings in the original data set that I pulled from the hundreds and hundreds of listings for 2011 were labeled incorrectly. The subdivision that was listed for those three properties was Tuckahoe Village when, in fact, it should have been Tuckahoe Village West. Sometimes it seems that the auto correct feature may have taken over one too many times when someone is typing. West, not West. What’s the big deal, you say?
The big deal is that this skewed the average price around $4,000 and also made it seem that the highest sale in the subdivision was somewhere around $257,000.00 when in fact the highest sales price in the subdivision was $225,000.00
I won’t name any names but let’s just say that three agents who listed those properties didn’t quite get their geography correct and failed to even notice that the tax records on the properties that they listed had a different label for subdivision than what those agents used.
That’s odd. I would hope that the Agent that is listing my house is at least paying attention to the correct location of the house they are listing for me! And that the agent would have at least looked at the tax records. How else would they know what the County assessed value is for the property? How else would they know the prior sale info–if any–on the house?
In any case, the advantage I have is that I generally take an entire data set straight from the MLS and do my own analysis as well as the one-button solutions for charting and trending that are out there like rbiStats. (I use rbiStats but really only for a quick snapshot of something.)
